Chapter 3. Demonstrating Editorial Focus and Learning About Your Data
In the previous chapter, we introduced the data visualization methodology, starting off with a look at two important preparatory activities: establishing the project's purpose and identifying the influencing factors surrounding the project.
It is worth acknowledging that the intention of our visualization may evolve, particularly as we journey through the upcoming design phases and as new influencing factors emerge. Any decisions we make across this process can be revisited and refined but the greater clarity we achieve now will ultimately help minimize wasted efforts and lead to a more efficient process.
In this chapter, we move on to the next phase of the methodology where we look at the intertwining issues of the data we're working with and the stories we aim to extract and present. This activity provides a bridge between project inception and design conception and involves the following tasks:
- We will look to develop and refine our editorial focus around the key communication dimensions of our visualization problem: What is the story we are trying to tell? What is the key narrative we are looking to portray? What questions do we wish readers to be able to answer through the visualization?
- One of the biggest challenges, and usually the most time-consuming, is the acquiring and preparing of the data, ensuring it is fit for purpose, and in good shape in advance of the design stage. We'll explore the mechanics of working through this often hidden activity.
- Finally, we'll see an example of how we can use visual analysis techniques to combine the task of familiarizing with our data and discovering key insights. We will show how learning about the physical properties of data helps you develop your editorial focus, specify your data questions, and influence the potential design choices we make later on.
The importance of editorial focus
The following is a quote from Edward Tufte (http://adage.com/article/adagestat/edward-tufte-adagestat-q-a/230884/):
"Good content reasoners and presenters are rare, designers are not."
In Chapter 2, Setting the Purpose and Identifying Key Factors, we looked at some of the considerations involved in identifying the purpose behind your visualization project; these are as follows:
- What is the reason for its existence?
- For whom are we creating it and how well defined are the requirements?
- What function is it seeking to fulfill?
- What is the likely tone of the design we're intending to portray?
Over the course of the full design process, it is possible that these initial definitions may need to be modified. As we learn more deeply about the relationship between what we want to do, what we can do and, importantly, what we should do, our creative proposition may be molded into a slightly shape.
That's fine and is to be expected. However, the earlier we can make firm judgments on our creative direction the better. This gives us a solid starting point and helps inform the important decisions we need to make about what it is we are trying to say with the visualization we are developing.
The matter of how this is said will be covered in the design stage but, ahead of that work, we first need to determine what are the specific messages we are looking to communicate to our audience.
Some of the most influential and esteemed visualization and infographic design work, perhaps unsurprisingly, comes from newspaper and magazine organizations.
The New York Times would probably be at the top of many peoples' list of the most celebrated graphics work, but there are so many other examples of great innovation and excellence from across the industry and right around the world, including The Guardian (UK), National Geographic (US), the Washington Post (US), the Boston Globe (US), La Informacion (Spain), and Época (Brazil), to name but a few.
A key reason behind the success of the work produced by these departments is the demonstration of what Edward Tufte describes at the beginning of this section—editorial focus.
Regardless of the size and inherent complexity of the data challenge you are working on, this is one of the most important capabilities you will need to develop in order to succeed in data visualization and is something that can singularly influence the success, or otherwise, of a design.
An editorial approach to visualization design requires us to take responsibility to filter out the noise from the signals, identifying the most valuable, most striking, or most relevant dimensions of the subject matter in question.
To do this we need to weigh-up the potential appetite of the intended audience—what it is we think they will want to know or will find interesting—and the opportunities that exist within the data—what data stories can you find and might you portray.
Determining what an audience needs is not always straightforward, particularly when you might have a broad range of different types and background of readers engaging and interpreting your work. Nevertheless, you should still have a sufficiently sympathetic view of how your target demographic will most positively and constructively relate to different slices of analysis of your subject matter.
For projects triggered by a client or colleague, there may be specific analytical dimensions that are already established and you have been asked to present and communicate them. The scope for veering away from this existing focus may not exist.
Otherwise, irrespective of whether you are tasked with the work or just pursuing a self-initiated curiosity, in most cases, you will have a certain degree of liberty to undertake the dual role of analyst and storyteller influencing the selection of what you will portray.
The execution of a design is clearly hugely significant to the success of a project, but without the foundation clarity and justification for the message you are trying to communicate, your resulting visualization will fundamentally lack focus.
Rather than just throwing everything available at a reader, good visualization involves showing a degree of editorial care—just because you have some data, doesn't mean to say you have to use it all. Be selective.
This attitude is necessary for all types of visualization projects. You might think the idea of telling stories is only relevant for explanatory pieces. That's not the case. With exploratory designs you still need to demonstrate this editorial focus. The difference is that with these projects you are not so much telling stories rather you are making them accessible and discoverable. You still need to frame the subject matter and define the important dimensions of analysis that will be made available for manipulation and interrogation. You still need that level of care for the audience's interpretive experience.
As we'll see later, some of the most effective data visualization designs manage to create a combination of these functional characteristics, offering a sweet spot of engaging exploratory features framed within defined story dimensions.
Conversely, if you take a look at a gallery of visualization work and find examples that you believe are ineffective, they will likely exhibit a weak narrative, an absence of stories, and a lack of genuine care for the interpretive needs of the audience. This is a really influential dimension of visualization design.
Preparing and familiarizing yourself with your data
The following is a quote from Simon Rogers, The Guardian, Facts Are Sacred: The Power of Data:
"80% perspiration, 10% great idea, 10% output."
Before we get too far down the line of developing and defining our intended stories and analytical slices, we need to roll up our sleeves and get our hands dirty with the task of accessing and preparing our data.
Whether you get the data first or shape your desired story dimensions first is mainly going to be influenced by the context of your project. It is a somewhat "chicken and egg" situation—which comes first, the data or the focus? You need some focus to determine what data you need, but you don't know what potential insights exist in the data until you have it.
It is best to accept that there will be a certain amount of iteration as you alternate between the mindset of a data scientist and a journalist progressing both issues simultaneously.
Data is our raw material, the principle ingredient in our creative recipe. Irrespective of what we intend or hope to show through our visualization design, the data will ultimately do the talking.
If we don't have the data we want, or the data we do have doesn't tell us what we hoped it would, or the findings we unearth aren't as interesting as we wish them to be there is nothing we can (legitimately) do about it. That is an important factor to remember. No amount of 3D-snazzy-cool-fancy-design dust sprinkled on to a project can change that.
An incomplete, error strewn or just plain dull dataset will simply contaminate your visualization with the same properties. So, the primary duty for us now is to avoid this happening, remove all guessing and hoping, and just get on with the task of acquiring our data and immerse ourselves into it to learn about its condition, its characteristics, and the potential stories it contains.
To achieve this, we must go through the often painful mechanics of data familiarization and preparation; as follows:
Acquisition: First, you need to get hold of your data. As we have discussed, this might already be provided to you from those commissioning the work. You might have independently formed a sense of the specific subject dimensions on which you require data. Alternatively, it may be that you have yet to focus beyond a broad subject level. It all really depends on how well-defined your requirements or intentions already are.
The places where you might acquire your data and the methods to accomplish it will be something you will know best. It could come from origins such as these:
- Obtained from a colleague, client, or other third-party entity
- A download taken from an organizational system
- Manually gathered and recorded
- Extracted from a web-based API
- Scraped from a website
- Extracted from a PDF file (you have my sympathies)
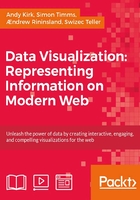
Here, we see an image taken from a visualization project that was created to demonstrate the social expansion of the US using the story of the spread of post offices. In this screenshot of the final piece, we see a representation of the 11,000+ post office locations recorded across the country between 1700 and 1900:

Image from "Posted: Visualizing US Expansion Through Post Offices" (http://blog.dwtkns.com/2011/posted/), created by Derek Watkins
The entire data for this project was scraped from the US Postal Service website. After cross-referencing the dataset with a gazetteer to establish accurate geo-locations, almost 1,500 records (12 percent) had to be discarded, as they weren't readily "mappable".
This just shows the great amount of effort and pain that often goes in to sourcing and preparing your data. No matter from where you are accessing your data, you will often have to work hard to get it into the shape and form that you need it. Therefore, you need to ensure you have factored in as much time as possible for this vital stage of the process.
Examination: Once we've got the data, a thorough examination will determine your level of confidence in the suitability of what you have acquired. This involves assessing the completeness and fitness of the data to potentially serve your needs. There are many tools out there that can help you work through this stage efficiently. Depending on the size and complexity of your data, and obviously your own capabilities, software like Excel, Tableau, or Google Refine (among plenty of others), will enable you to quickly scan, filter, sort, and search through your dataset to establish its state of quality. As you go through this process, you should be examining the following potential issues:
- Completeness: Is it all there or do you need more? Is the size and shape consistent with your expectations? Does it have all the categories you were expecting? Does it cover the time period you wanted? Are all the fields or variables included? Does it contain the expected number of records?
- Quality: Are there noticeable errors? Are there any unexplained classifications or coding? Any formatting issues such as unusual dates, ASCII characters? Are there any incomplete or missing items? Any duplicates? Does the accuracy of the data appear fine? Are there any unusual values or obvious outliers?
Data types: Understanding the properties of our raw material is such an important task. We will do some visual exploring later to learn about the physical patterns and relationships but, for now, we need to understand the fundamental structure of our data in terms of the variables types. This will become important when we move into the design discussion in Chapter 4, Preparing and Familiarizing With Data. The following table outlines the discrete types of data with associated examples:

As well as capturing the types of data we have, it is a useful exercise to also make a note of the range of values or at least a sample of the data held against each field. For illustration, this might be from a dataset about the Olympics:

Transforming for quality: This task is naturally about tidying and cleaning your data in response to the examination stage above. We are looking to resolve any of the errors we discovered in order to transform the condition of the data we're going to be working with for our design. Plugging the gaps caused by missing data, removing duplicates, cleaning up erroneous values, and handling uncommon characters are just some of the treatments we may be required to apply.
Transforming for analysis: In contrast to transforming for quality, we move away from cleaning data and focus more on preparing and refining it in anticipation of its intended use for analysis and presentation. Here, we consider actions such as:
- Parsing (split up) any variables, such as extracting year from a date value
- Merging variables to form new ones, such as creating a whole name out of title, forename, and surname
- Converting qualitative data/free-text into coded values or keywords
- Deriving new values out of others, such as gender from title or a sentiment out of some qualitative data
- Creating calculations for use in analysis, such as percentage proportions
- Removing redundant data for which you have no planned use (be careful though!)
Another important consideration is to determine what level of resolution you might wish to, or indeed need to, present your data. The decision you take about this may require you to aggregate or disaggregate your data to achieve get the right level of detail.
Design agency Periscopic were faced with some intricate resolution decisions in their preparatory work for this near real-time visualization developed about the Yahoo! Mail network. The objective was to show the huge volumes of e-mails being sent and processed around the world at any given point, and the efforts Yahoo! is taking to help reduce and intercept spam e-mails. This is shown in the following screenshot:

Image from "Visualizing Yahoo! Mail" (http://www.periscopic.com/#/work/yahoo-mail/), created by Periscopic
With approximately 5.6 billion e-mails (and a further 20.5 billion spam) sent every day, the sheer amount of data potentially being fed into this project clearly posed a challenge in terms of what level of detail they could reasonably show.
This was not just a matter of how they could handle the velocity and volume of new data on the technical side but also what was the appropriate resolution with which to tell this story
They decided on the following strategy:
- The headline statistics shown in the titles and presented across a range of supplementary graphics across the project would be representative of the full data quantities.
- For the geo-spatial view, a carefully designed algorithm was applied to extract a representative sample of data. This would be more than adequate to capture the nuances of the activity seen with the full dataset and would avoid the technical impracticalities involved in attempting to show 100 percent of the data.
- The geographical data was clustered to a city or regional aggregate, represented by the circle positions and sizes, to help draw out the key signals and patterns.
This is a perfect demonstration of how important it is to handle data resolution issues as early as possible so we know what treatment to apply to our data.
When you are faced with similar decisions, albeit perhaps rarely on the same scale, you will typically have these options available to you:
- Full resolution: Plotting all data available as individual data marks.
- Filtered resolution: Exclude records based on a certain criteria.
- Aggregate resolution: "Roll-up" the data by, for instance, month, year, or specific category.
- Sample resolution: Apply certain mathematical selection rules to extract a fraction of your potential data. This is a particularly useful tactic during a design stage if you have very large amounts of data and want to quickly develop mock-ups or test out ideas.
- Headline resolution: Just showing the overall statistical totals.
Consolidating: When you originally access your data, you will likely believe, or hope that you have everything you need. However, it may be that after the examination and preparation work, you identify certain gaps in your subject matter.
Additional layers of data may be required to be combined ("mashed-up") with our existing dataset, applied to perform additional calculations, or just to sit alongside this initial resource to help contextualize and enhance the scope of our communication. Always spend a bit of time considering if there is anything else you anticipate needing to supplement your data to help frame the subject or tell the stories you want to communicate.
Seasoned designers will confirm that acquiring, handling, and preparing your data is often the most time-consuming and intensive activity involved in any visualization project.
It is the hidden battle. As Simon Rogers quantifies at the start of this section, if you imagine a visualization design project as an iceberg, the final design would be the bit we see sticking out of the water and the ugly data preparation work would be the vast amount hidden beneath the surface.
There is a good chance that you will have expended most perspiration in the many thankless, uncelebrated duties you have to undertake in this part of the process. However, just know that the value of your efforts and the associated rewards will emerge in due course, so try not to lose enthusiasm or patience.
Refining your editorial focus
The following is a quote from Amanda Cox, New York Times (http://seekingalpha.com/article/66269-an-amazing-graphic-on-box-office-receipts):
"Different forms do better jobs at answering different types of questions."
Now that we have prepared our data, we revisit the matter of editorial focus.
To avoid being prematurely tempted into diving into the construction of a visualization design, we first need to do more work to fine-tune our analysis of what are the important messages.
In the first section, we explained the importance of taking responsibility to make sense of data, to find stories and tell stories to your intended audience. This demonstrates a level of care. It shows that you are not just going through the motions of communicating; you are taking it seriously, seeking to help your audience unlock insights from the subject matter.
The journalistic capability for unearthing the most relevant stories from data is a talent that any designer should aspire to develop.
In the example shown in the following screenshot, we see a recent visualization project that was developed to enlighten people about the matter of education around the world, presenting some striking facts and figures:

Image from "In Numbers: Education Around the World" (http://visualdata.dw.de/specials/bildung/en/index.html), created by Gregor Aisch for Deutsche Welle.
As you might imagine there will be myriad ways of telling data stories about global education matters. In such contexts, a designer is faced with the challenge of rationalizing so many different potential dimensions.
The strength of this particular project comes from the scoping and definition of the chosen narrative and slices of analysis. Rather than bombarding the reader with endless pages of facts and figures, or offering seemingly infinite combinations of interactive variable selections, the subject is framed for us around a small number of interesting angles about education: literacy by region, literacy rates by country/gender, enrollment ratios, and expenditure on education versus military.
As we then navigate through each story panel we are presented with a series of explanatory visualizations. They don't just show data, they present and explain it.

Image from "In Numbers: Education Around the World" (http://visualdata.dw.de/specials/bildung/en/index.html), created by Gregor Aisch for Deutsche Welle
In this example, we see a scatter plot of education spend versus military spend for all countries. But it is more than just a plot. The designer takes responsibility for telling the story, providing effective written (labeling and captions), and visual annotation (reference lines and background shading) to help maximize the potential insights. The inclusion of filtering features to highlight particular countries and regions introduces an exploratory dimension to enable the discovery of further layers of understanding.
This is a strong demonstration of editorial focus and storytelling with data—four key stories, elegantly told.
What we see with this project is a visualization that answers "data questions". Data questions are the lines of interrogation and the dimensions of interpretation users will likely seek to pursue when reading a visualization design.
It's more than just framing a story, it is about the specific insights we are making accessible. It is the most defined and detailed level of editorial focus we should aim to achieve. We want our visualization to be able to respond to the most likely and relevant questions a user will raise about the data and the subject matter.
At this point, we are starting to consider the relationship between our editorial focus and the potential visualization design options.
As Amanda Cox describes earlier, the way that you choose to represent your data—the form you give it through your selection of chart type—should be influenced by the questions you are trying to answer.
For instance, if you are asking a chart to facilitate a comparison between the values of different categories, you might deploy a bar chart. You wouldn't use a line chart to achieve this, but you would if you wanted to show how a value or values change over time. The scatter plot we just saw was the perfect method of comparing two quantitative values for all those different countries. It was the right form to answer the specific data questions identified.
So we need to know what questions we're trying to answer.
Unless you've already had them specifically outlined to you, an effective approach to tackling this can be drawn from the practice of logical reasoning, specifically induction and deduction. These techniques are common to academic and scientific research.
Deductive reasoning involves confirming or finding evidence to support specific ideas. It is a targeted and quite narrow approach concerned with validating certain hypotheses. A deductive approach to defining your data questions will involve a certain predetermined sense of what stories might be interesting, relevant, and potentially available within your data. You are pursuing a curiosity by interrogating your dataset in order to substantiate your ideas of what may be the key story dimensions.
Inductive reasoning works the opposite way. It is much more open-ended and exploratory. We're not sure precisely what the interesting stories might be. We use analytical and visualization techniques to try and unearth potentially interesting discoveries, forming different and evolving combinations of data questions. We may end up with nothing, we may find plenty—the insights we observe may be serendipitous as we follow our nose for the scent of evidence. Fundamentally, this is about using visual analysis to find stories.
For most visualization projects, if we have the time, ideally we would seek to use both deduction and induction in conjunction in order to learn as much as possible about what stories the dataset can reveal about the given subject matter.
Using visual analysis to find stories
The following is a quote from Ben Schneiderman:
"Visualization gives you answers to questions you didn't know you had."
In the Chapter 2, Setting the Purpose and Identifying Key Factors, we discussed the different intentions and motives you might have for developing a data visualization. In most cases we think of it as something we create and provide to others. What we sometimes neglect to consider is the potential of visualization for ourselves, when we are the intended users looking to discover insights about a subject.
This is where we consider the application of visual analysis. Visually analyzing a dataset, and employing both inductive and deductive reasoning, enables us—as the designer—to learn more about our subject by exploring a dataset from all directions.
As Ben Schneiderman articulates above, and as we saw through the demonstration of Francis Anscombe's experiment, rather than just looking at data, we are using visualization to actually see it, to find previously undiscoverable properties of our raw material, to learn about its shape, and the relationships that exists within.
This activity can also be described as data sketching or preproduction visualization. We are using visualization techniques to become more intimate with our raw material and to start to form an understanding of what we might portray to others and how we might accomplish that.
Visual analysis requires a high degree of graphical literacy, the ability to read and interpret data represented visually. This is something we might not really think about too often. In fact, if we're honest, many of us would probably have to admit that we can actually be quite passive in how we engage with a visualization or infographic.
This activity requires a much more committed level of attention to interpretation. As we explore the evolving visual analysis of our data, we need to be prepared to observe the following characteristics that will lead to the identification of our key stories:
Comparisons and proportions:
- Range and distribution: Discovering the range of values and the shape of their distribution within each variable and across combinations of variables
- Ranking: Learning about the order of data in terms of general magnitude, identifying the big, medium, and small values.
- Measurements: Looking beyond just the order of magnitude to learn about the significance of absolute values
- Context: Judging values against the context of averages, standard deviations, targets, and forecasts.
Using methods like a bar chart will enable comparison across values and categories to pick out the type of physical qualities just listed, as shown here:

Trends and patterns:
- Direction: Are values changing in an upward, downward, or flat motion?
- Rate of change: How steep or flat do pattern changes occur? Do we see a consistent, linear pattern, or is it much more exponential in shape?
- Fluctuation: Do we see evidence of consistent patterns or is there significant fluctuation? Maybe there is a certain rhythm, such as seasonality, or perhaps patterns are more random
- Significance: Can we determine if the patterns we see are meaningful signals or simply represent the noise within the data?
- Intersections: Do we observe any important intersections or overlaps between variables, crossover points that indicate a significant change in relationship?
Using a line chart is a perfectly suitable method to observe patterns and trends, as we see below:

Relationships and connections:
- Exceptions: Can we identify any significant values that sit outside of the norm, such as outliers that change the dynamics of a given variable's range?
- Correlations: Is there evidence of strong or weak correlations between variable combinations?
- Associations: Can we identify any important connections between different combinations of variables or values?
- Clusters and gaps: Where is there evidence of data being "bunched"? Where are there gaps in values and data points?
- Hierarchical relationships: Determining the composition, distribution, and relevance of the data's categories and subcategories.
Using a scatter plot will enable visibility of these types of relationships, as shown below:

Through embarking on such in-depth visual analysis we should achieve the level of data intimacy required to refine our editorial focus. The visual interrogations we perform on the data will unearth evidence of the features listed over the previous couple of pages.. Where we find these, we will find the stories.
The process of visual analysis can potentially go on endlessly, with seemingly infinite combinations of variables to explore, especially with the rich opportunities bigger data sets give us. However, by deploying a disciplined and sensible balance between deductive and inductive enquiry you should be able to efficiently and effectively navigate towards the source of the most compelling stories.
The chart types that we have seen being used previously are illustrative of just a small section of the gallery of options we have to call upon. We will learn much more in Chapter 5, Taxonomy of Data Visualization Methods, about the different chart types and their functions to understand which ones are best deployed for different enquiries of our data.
The product of our work here is a more sophisticated understanding of the stories existing in our datasets about the given subject matter. This will help us form the specific data questions that we'll be asking our visualization designs to answer. We've found our stories, now we need the appropriate methods to tell them and that's what Chapter 4, Conceiving and Reasoning Visualization Design Options, will explore.
An example of finding and telling stories
Before we move on, to help embed the understanding of data familiarization, visual analysis and the difference between finding stories and telling stories, let's work through a basic example.
Take the following sample table of data. The subject matter is the Olympic games and specifically the total medals won by the top eight participating nations over five recent events. The selection of the top eight is based on them being the top ranked countries at the Beijing Olympics in 2008.
Suppose you were briefed to unearth some key stories around Olympics medal winning trends in recent years, how would you go about it?

Let's start by just scanning the data with our eyes to find anything that stands out.
The main data issue appears to be that the Russian Federation medals total for 1992 was actually when it was known as the Soviet Union. It is noticeably higher than for all the other Olympic events, due to the contributions of additional member states that then made up the Soviet Union but who are now independent countries competing in their own right. As it will be hard to unpick this value to isolate just those athletes who would now be considered part of the Russian Federation, it will be sensible to just ignore this value from our analysis. Otherwise, it will skew our interpretations.
We can see that the event order goes from left to right in reverse chronological order and the vertical sorting is organized by the most successful nations as at 2008. In addition to the medal winning totals for the selected countries, we also have the aggregate of all medals across all countries.
We now continue our examination by noting some of the dataset's descriptive and statistical properties to develop an increased level of familiarity:
- Two variables: Country and event year
- Country is a categorical nominal variable with nine values (each country and the aggregate)
- Event year is a quantitative (interval-scale) variable with five values
- The maximum country medal count value is 110 medals, the minimum is 15
- The maximum aggregate value is 951 and the minimum is 815 (but that includes the Russian Federation contribution)
- Each event year is spaced 4 years apart
- The longest country name is People's Republic of China, the shortest is France
This gives us a sense of the physicality of the data and the potential influencing attributes that might shape our visualization architecture.
What other data preparation tasks might we undertake?
We have no real transformation activities to undertake in terms of addressing data quality aside from already deciding to ignore the Russian Federation total.
For transforming the data for its use in analysis we may decide to create some calculations to show the percentage of medals won out of each event total. You may also decide to abbreviate some of the county values to potentially help accommodate the space required for labeling.
We also need to consider data consolidation. For the purpose of this demonstration, we are going to stick to our original dataset on its own but there could be many different options to enhance and contextualize this subject matter, including the following:
- The details behind the medal totals of how many golds, silvers, and bronzes each country has won
- The full dataset of medal statistics for all the other countries who have competed, not just the recent top eight
- The full dataset of medal statistics for every Olympic games
- The number of competitors who were taking part in the games for each country, in order to understand the percentage of success of each team
- The split of performances between the different sporting events
- Population figures to contextualize the achievements, maybe even sporting participation figures if they were recorded
- Historical milestones of socio-political and geo-political issues to help us appreciate the status of the different countries at these key points in time
- You might look to bolster the ingredients of your visualization design resources with national flags' image files or URL links to national Olympic associations
Whether we could obtain these additional data items is another matter and they may not even help with our stories. But it is always good to let your imagination roam and explore ideas for content that could really enhance your work.
Our data is now in good shape. Next up, we look to develop our editorial focus, specifically considering the following:
- What initial sparks of curiosity crossed our minds when we were given the brief and initially saw the data?
- What dimensions of analysis do we think might be of interest or relevance about this subject matter?
- What data questions will we seek to answer in our visualization design?
To refine our focus we need to commence our visual analysis work to explore our dataset and see what comparisons, trends, patterns, and relationships we can identify. Out of this we will hope to unearth some interesting stories to tell.
Given we have a small dataset with only two variables we shouldn't need to embark on too much varied visual analysis.
The first graphic takes a look at the variation of medal winning across the years, showing the range of totals for each country using a floating bar chart:

Through interpreting this chart in conjunction with the descriptive statistics we just collected, we are able to form some interesting data questions about the subject and start to get a feel about the main stories, such as:

Let's now repeat the same chart type but apply it to a transformed version of the data that has been standardized to show the medals won as a percentage of the overall total:

Does this alter the focus of our questioning or change our impressions of the main insights?
If anything it reinforces them, especially our interest in the varied performance levels for Germany and China. It also emphasizes the remarkable consistency of Republic of Korea and France.
At this point, we have definitely established a scent for the story. We have started to articulate the data questions that best interrogate this data and most likely reflect what the readers of a visualization about this subject will wish to learn.
We now need a different visual representation. Using the floating bar we have seen the categorical view of the countries and their performances. Now, we need to switch our perspective to the other main variable, that of event year, to pursue our curiosities about the transition of medal-winning performances and the transition in ranking of the individual countries across the five Olympic Games.
For this next visual sketch we turn to a line chart. On this single chart we plot the eight countries, differentiated by color, showing the absolute medal wins from left to right across the five Olympic events:

It looks a bit messy doesn't it? Don't worry. Remember, this is an exploratory visualization for ourselves. We are the audience and we just want to see if we can discover some interesting physical properties about the data in this display.
You wouldn't and shouldn't publish an isolated, cluttered, and poorly-annotated chart like this to convey a story to others, but when it is a visualization serving yourself, it is a different matter. You created it and you know what you're looking out for. Quick and dirty is absolutely fine.
The decision to place all countries onto one graphic is to enable visibility of the interesting transitions, the crossovers, the seemingly cluttered parts, and the empty parts. You could separate each country out into its own line chart and assess a matrix of eight small-multiples. However, this would only show you the individual country stories. Our keen interest here is in the relationship between the countries.
The chart shows how Germany's (blue) wide range of results, actually reflects their general decline in medal winning levels and, by extension, their relative rank.
By contrast, China's wide distribution shows a country on the rise over the past four games at least. The extended fascination of this trend would be whether they will catch up and possibly overtake the US once we have the results and data for the 2012 Games (not available at the time of writing this book!).
Elsewhere, Russia can be seen to have moved up and down over the years and has now been overtaken by China. There is an interesting chunk of white space for the 2008 results either side of the Russian value, leaving them quite comfortably in third position. Interestingly, the UK has seemingly demonstrated a very similar pattern of improvement relative to the Chinese over the past five events.
Sometimes no change is as interesting as some change and, in this respect, the consistency of Republic of Korea is quite stark given the different generation of competitors who will have contributed to those totals.
Otherwise there is nothing else really of significant interest. The charts have served their purpose in discovering and confirming some relevant and interesting stories concerning the contrasting experiences of China, Germany and, potentially, the Republic of Korea.
Of course, sometimes you simply may not find a story. There just might not be anything of substance to convey to others visually, in which case a table of data may prove to be the most appropriate solution.
However, we have found our stories, so how do we tell them? As a bridge to the next chapter, where we will be focusing on design matters around presenting our stories, let's attempt a quick solution.
Remember the quote we saw earlier from Amanda Cox: "different forms do better jobs and answering different questions"? Let's reduce the story to a simple contrast between China and Germany. Our main data question will be something like "how have the medal-winning performances of China and Germany compared over the past five events?"
The most suitable method for giving form to and answering this question will still be a line chart. Similar to the one we used for the visual analysis, we are trying to show the relationship between these two countries' respective performance over time.
However, the design execution will be different. This time we're conveying the story to others, so we need to refine the visuals in order to make it an explanatory piece:
- We need to elevate the important features of the main story and relegate any background context and secondary content.
- We need to ensure that there are annotations for labels, values, and captions so the reader is entirely clear about what is being communicated.
Here is a proposed solution for telling this story:

The first thing to point out is that we have used the calculated data for medals won as a percentage of the total. This is more appropriate for this story as it helps standardize and contextualize the performance across all events in a more comparable way.
The aim here is to provide a clear visual hierarchy emphasizing the two main countries in our story and diminishing the contextualizing six nations into the background. We could have removed the other six countries but, through the use of a subtle shade of grey, we can still see them well enough to get a sense of the overall rankings. That is all we need from them—context.
The title neatly frames the story, the subheading describes the chart and the data, and the labels help the reader compare the two countries' relative trajectory.
The use of color attempts to help imply the positive improvement (orange = hot = good) of China and the negative decline (blue = cold = bad) of Germany. Only the bare minimum chart apparatus (the axis line) is included, once again, to allow the main story to come to the fore.
Contrast this design approach for telling a story (explanatory) with the design of the same chart method we used to find the stories (exploratory); here we provide nothing more and nothing less than the reader requires to easily interpret the story. This use of contrasting visual approaches for the same chart types but for different intentions is important to recognize in your design work.
Summary
In this chapter, we have learned about the importance of editorial focus and content reasoning—the ability to recognize the most important and relevant stories in your data and the discipline of taking responsibility to optimize the interpreting experience of your intended audience.
We worked through the mechanics of acquiring, preparing, and familiarizing with your dataset. In particular, we highlighted the importance of our own graphical literacy in the task of conducting visual analysis.
We identified numerous physical characteristics of our data that will help us to discover key stories and help inform the types of data questions we may seek to answer in our designs.
Finally, we worked through a demonstration of using visual analysis to make sense of your data, to find stories yourself and then tell those stories to others. We also saw an example of the contrasting visual design solutions used for exploratory and explanatory visualization.
Now that all our preparatory work has been covered, in the next chapter, we will move the methodology forward onto the design stage. Here we will learn about all the options we need to judge and the decisions we need to take across the five key layers that form the anatomy of any data visualization design.